Overview
Cisco ACI nodes behave a bit special in regards to memory usage, it’s not unusual to see high memory values of up to 90%. Some monitoring tools are not tuned correct and report the high memory values as error.
Even Cisco himself colors these values wrong in the ACI GUI (Bug: CSCvu05236). Values over 80% are displayed with a red color, even though they are inside the limits.
There was a Cisco ACI operating Guide, which provided information about which values to expect. But it’s no longer available. In the Cisco community is a reference of this document.
Switch memory utilization of 70-75% is normal, even for leaf and spine switches in a new deployment where no configuration has been pushed. Switch memory utilization in ACI mode should not be compared to utilization in standalone NX-OS mode due to the additional ACI-specific processes, which consume additional memory.
You should be concerned only if memory utilization exceeds 90%. Open a TAC case for proactive troubleshooting if memory utilization exceeds 85%."
This matches with what I saw at different customers.
How to check the memory utilization
As always, there are many ways to check the current memory usage of a ACI Node (Leaf or Spine). As long as you don’t find values above 85%, there is no need to worry. In the case of higher memory values, it’s advised to open a TAC case and double check that there is no real issue.
GUI
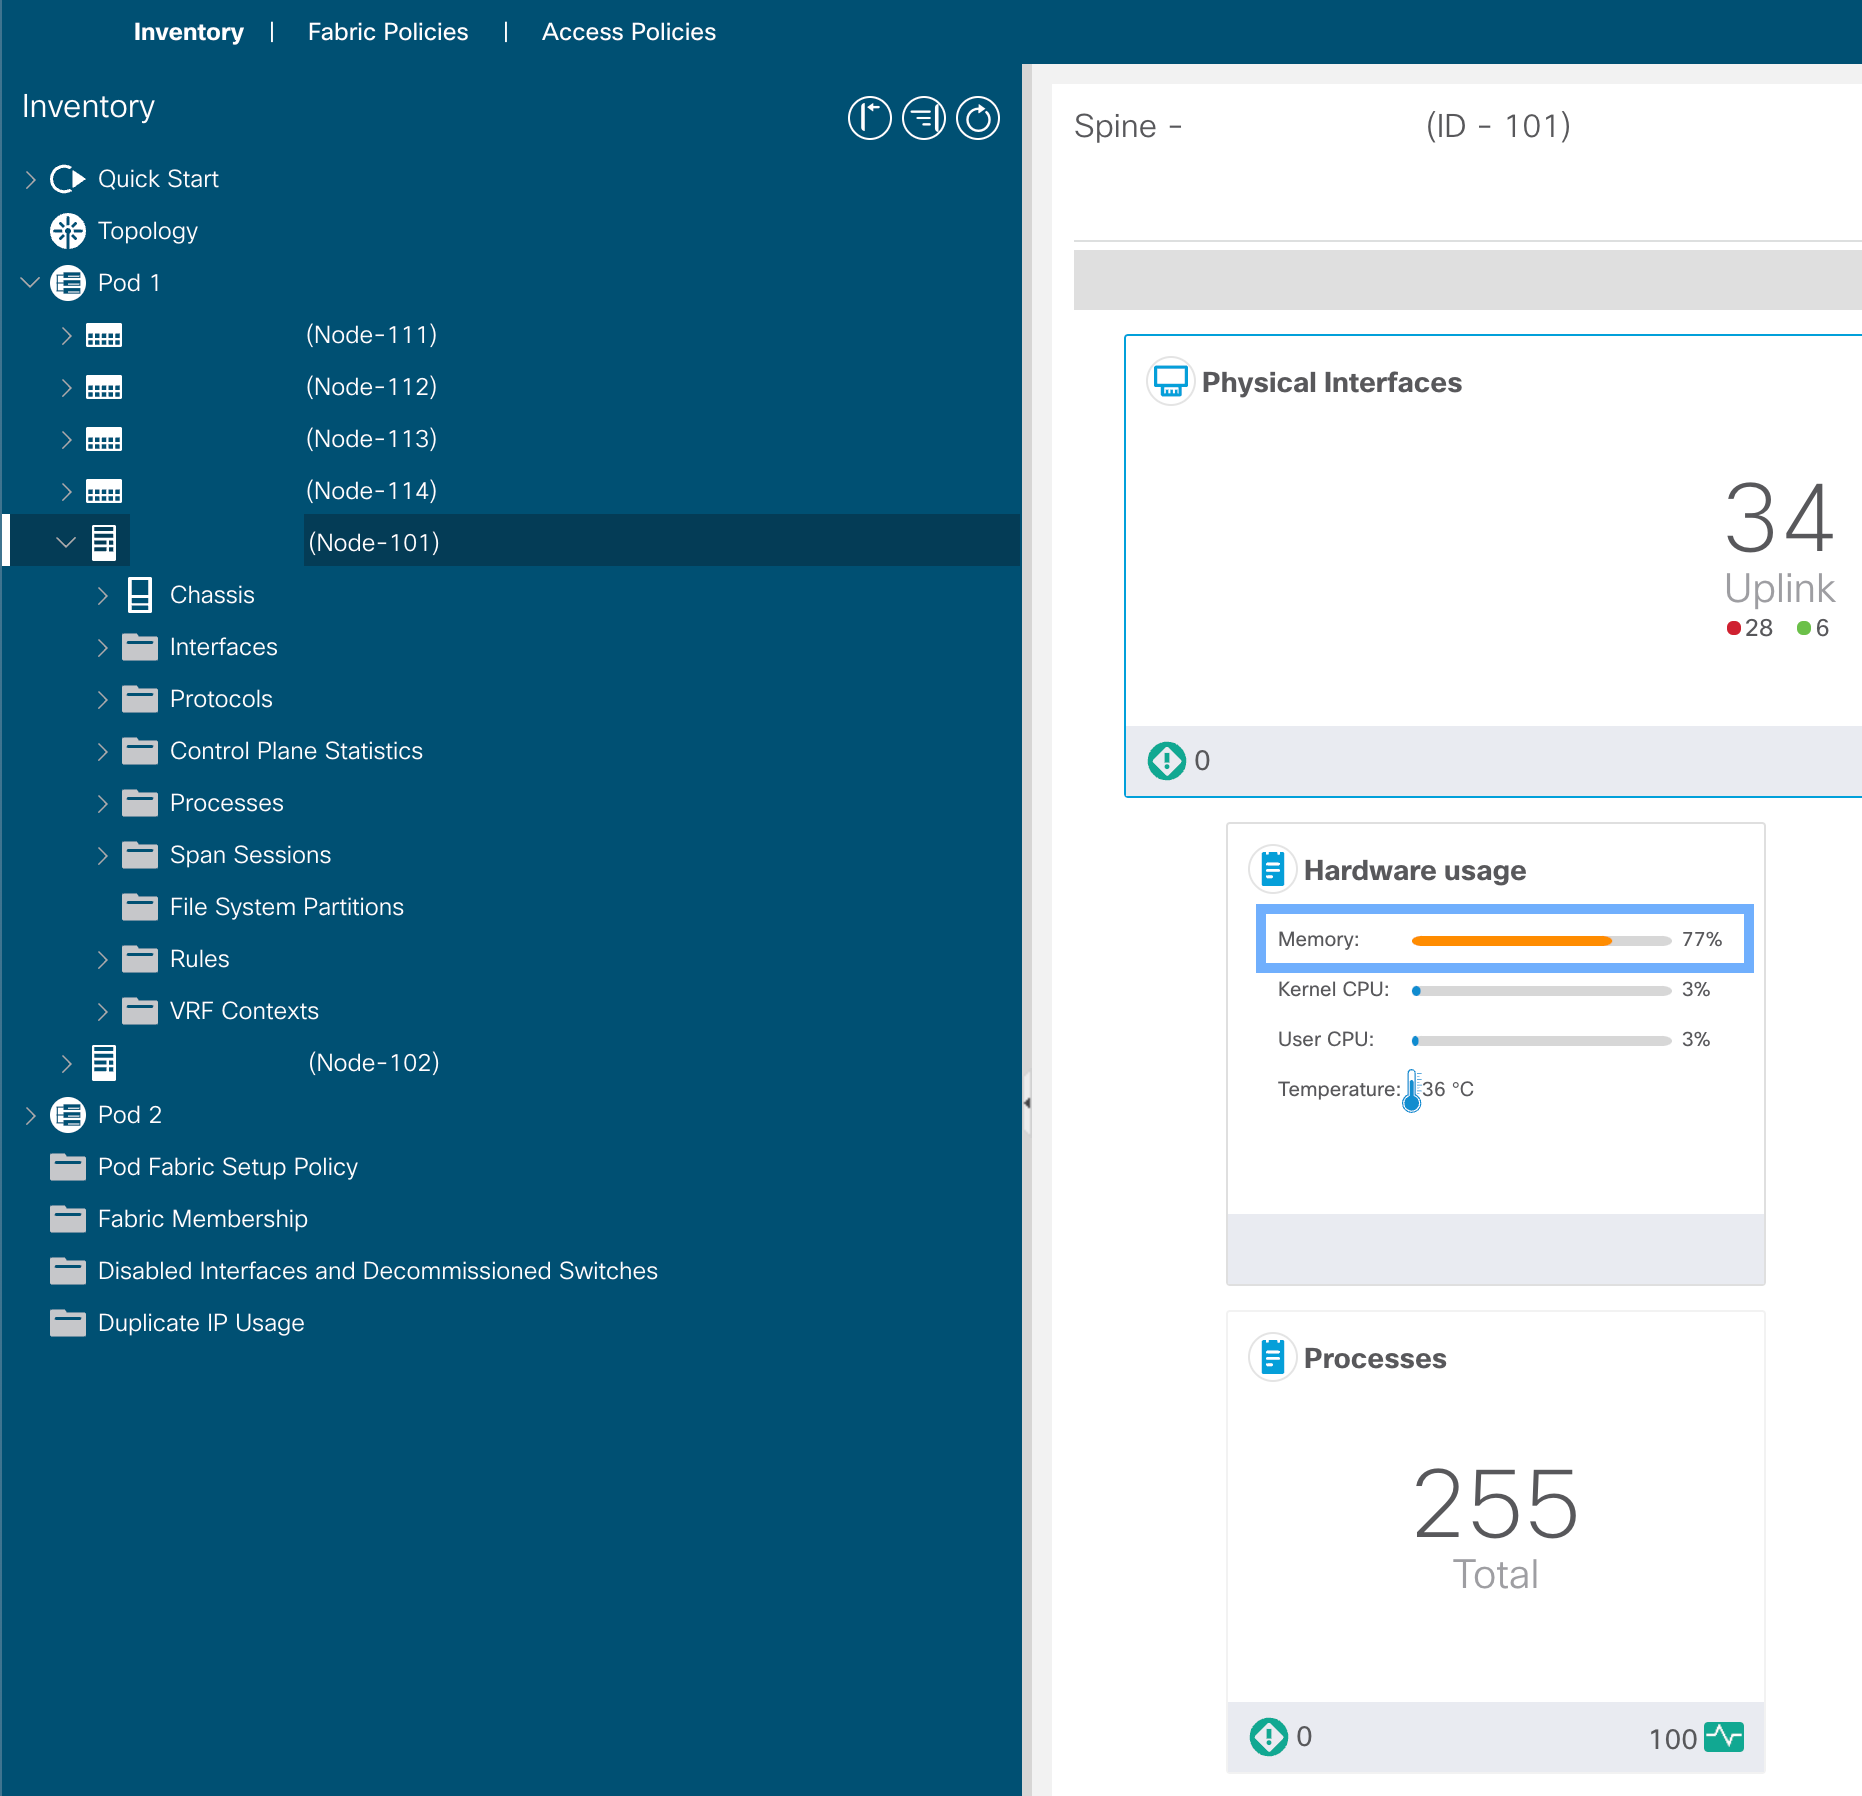
An easy way to check the current memory situation is in the ACI GUI. After you logged in, navigate to Fabric -> Inventory -> Pod X -> Select a Node.
In the summary tab of the Node you then can see the Hardware usage tab, which includes Memory. As mentioned before, you should ignore the color and check the value.
CLI
On the CLI you have different approaches, my favorite is show system resources. It not only shows the absolut values, it also provides an evaluation of the memory status. Current memory status gives you a good understanding of the current usage and if it’s an issue.
|
|
You can also leverage one of the many Linux commands to the get memory usage, e.g. cat /proc/meminfo
|
|
Or top
|
|
API
If you prefer the API way, you can also get the information there! :)
There are different classes which provide a different time span of the memory utilization.
E.g. procSysMem1d for 1 day averages. The call itself looks like this:
|
|
All the related classes:
- procSysMem5min
- procSysMem15min
- procSysMem1h
- procSysMem1d
- procSysMem1w
- procSysMem1mo
- procSysMem1qtr
- procSysMem1year
The result will include a list with entries for each node that is part of the fabric. It’s a good way to easy get an overview of the memory usage.
|
|
Summary
In this post you learned what it’s important to know about memory utilization on ACI (everything < 85% is fine) and how to check the memory usage through GUI, CLI and API.